To improve Core Web Vitals you fix three numbers: Largest Contentful Paint under 2.5 seconds, Interaction to Next Paint under 200 milliseconds, and Cumulative Layout Shift under 0.1. Most sites fail on LCP first, and the cause is usually one late-loading image rather than a site that is slow everywhere. Find the single failing metric, fix its biggest cause, and leave the rest alone.
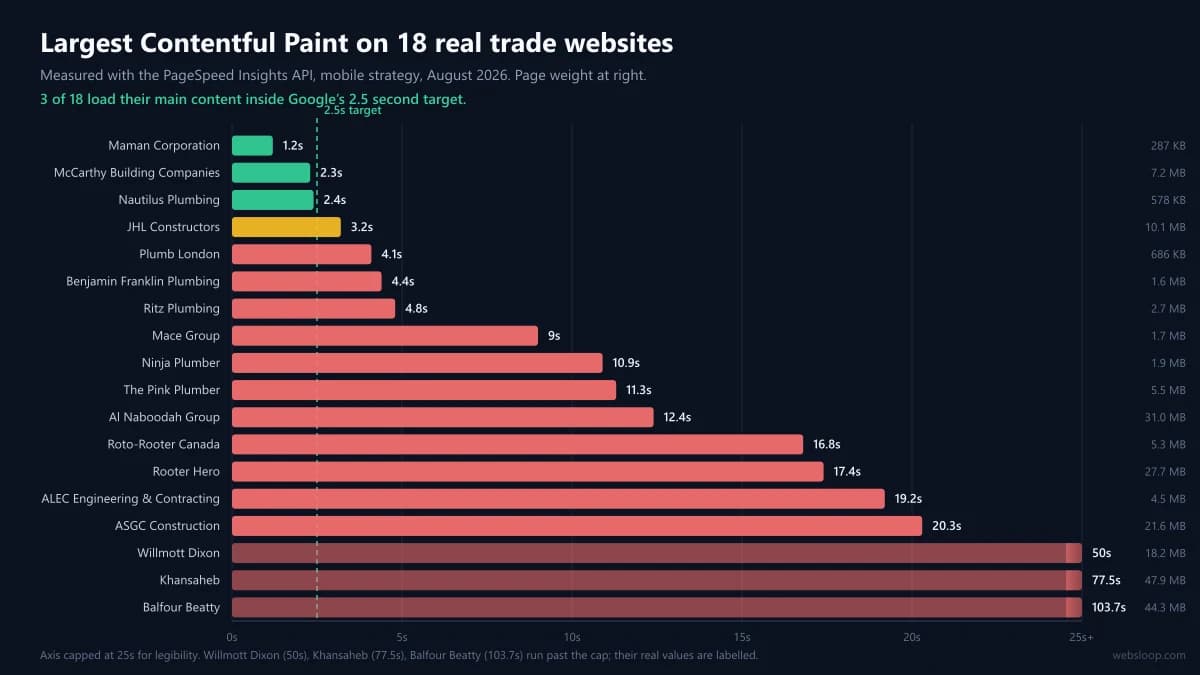
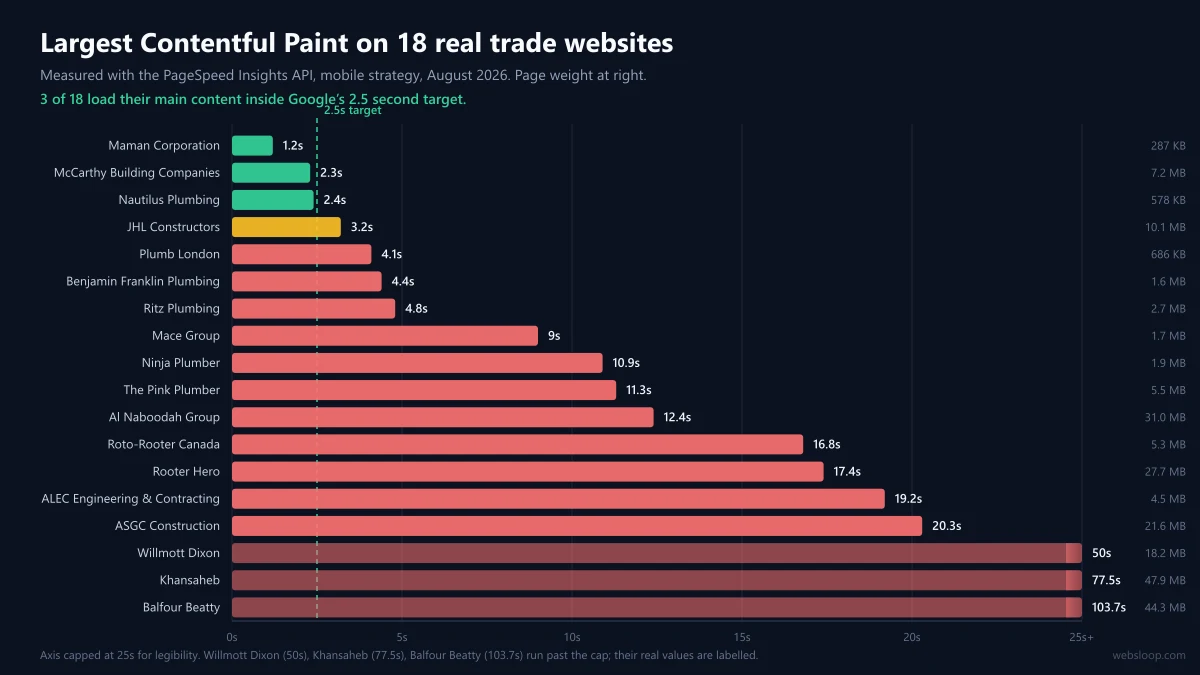
That advice is easy to give and hard to trust, so we measured 18 real trade websites to see what ordinary businesses actually score. 3 of the 18 passed LCP. Two passed both LCP and layout stability. The rest of this guide is what those numbers showed, including one result that contradicts the advice almost every speed article repeats.
What Core Web Vitals Actually Measure
Core Web Vitals are three metrics Google uses to score how a page behaves for real visitors. LCP measures how long the largest visible thing takes to appear. INP measures how quickly the page responds when someone taps or clicks. CLS measures how much the layout jumps around while loading. Google collects all three from actual Chrome users rather than from a test.
The thresholds come straight from Google Search Central, which publishes all three with the numbers to aim for:
| Metric | What it measures | Good | Poor |
|---|---|---|---|
| LCP | Loading. When the largest element finishes rendering | Under 2.5s | Over 4s |
| INP | Responsiveness. Tap or click to the next visual update | Under 200ms | Over 500ms |
| CLS | Stability. How much the layout shifts unexpectedly | Under 0.1 | Over 0.25 |
One detail catches people out. INP replaced First Input Delay on 12 March 2024. FID only timed the delay before the first interaction was processed, which almost everything passed. INP times the full response to every interaction across the visit, so sites that comfortably passed FID often fail INP without changing a line of code.
A second detail matters more than most guides admit: Google scores the 75th percentile of your visits, not the average. Your typical visitor can have a fine experience while a quarter of your traffic has a bad one, and it is that slower quarter Google grades you on.
What Real Small Business Websites Actually Score
Published guides show you a passing dashboard. We wanted to know what businesses like our clients really score, so we ran 18 plumbing and construction homepages through the PageSpeed Insights API on mobile in August 2026 and wrote down every result, including the ones that made uncomfortable reading.
3 of 18 loaded their main content inside 2.5 seconds. 2 of 18 passed both LCP and CLS. Median LCP across the set was 11.1 seconds, roughly four times the target. Maman Corporation came out fastest at 1.2 seconds. At the other end, Balfour Beatty took 103.7 seconds, which is not a typo and not a rounding error.
Page weight ranged from 287 KB to 47.9 MB. The heaviest page in the set ships more data than a feature film trailer to show a contractor’s homepage on a phone.
The full per-site tables, including layout shift, click-to-call counts and structured data, are published in the plumbing website study and the construction website study. Both list the measurement date and method so you can re-run any figure yourself.
The useful takeaway is not that these businesses are careless. It is that failing Core Web Vitals is the normal condition of a small business website, which means passing them is a genuine competitive advantage rather than table stakes.
Page Weight Is Not the Whole Story
Nearly every speed guide states the same rule: lighter pages load faster. Our data mostly agrees, and then two sites break it badly enough to be worth your attention.
McCarthy Building Companies ships a 7.2 MB page and still hits 2.3 seconds, passing the target. ALEC Engineering ships a lighter 4.5 MB page and takes 19.2 seconds. One site sends 60 percent more data and arrives eight times sooner. JHL Constructors does something similar at 10.1 MB and 3.2 seconds.
The difference is load order, not load size. A page that sends its hero image first and its analytics, chat widget and carousel scripts afterwards paints quickly no matter what it weighs in total. A page that blocks rendering on a stack of scripts stays blank while a small hero image waits its turn behind them.
This is why chasing a lower total page weight is often wasted effort. LCP does not measure your page. It measures one element. Fix what happens before that element renders and the number moves, whether or not the page got lighter.
How to Find Out Which Metric Is Actually Your Problem
Use two free Google tools together, and understand what each one is telling you, because they routinely disagree and only one of them affects your rankings.
- PageSpeed Insights gives you two things for any URL: a lab score from one simulated load, and field data from real Chrome users over the previous 28 days. Read the field data first. The lab score is a diagnostic tool, not your grade.
- The Core Web Vitals report in Search Console groups every page on your site into Good, Needs Improvement and Poor. This is where you spot patterns, for example every service page failing while the homepage passes, which points at a template rather than at individual pages.
A site can score 95 in the lab and still fail in the field. The lab test runs on a simulated mid-range phone on a clean connection. Your real visitors are on older handsets and patchy signal. When the two disagree, field data is the one Google uses.
Before changing anything, write down your current field numbers for all three metrics. Most of the time exactly one is failing, and the work is much smaller than it looks from a performance report full of red.
What Moved Our Own Numbers, and What Did Nothing
In August 2026 our own homepage was failing on mobile with an LCP of 4.7 seconds and a performance score of 79. We fixed it to 3.1 seconds and a score of 90. The interesting part is which change did the work, because our first attempt did nothing at all.
We started where everyone starts, with the biggest obvious file. The header logo was a 100 KB image that had no business being that size, so we cut it to under 5 KB. LCP did not move. That logo was never the largest element on the page, so shrinking it improved a number that was not being measured.
What worked started with finding the element Chrome actually treats as the LCP element. It turned out to be the first client logo in our homepage logo strip, which nobody would have guessed. We told the browser to prioritize it with a fetchpriority="high" attribute, then cut the eagerly loaded images on the page from 14 down to 7. Those two changes took 1.6 seconds off.
The lesson generalizes. Measure which element is your LCP element before optimizing anything, because optimizing the wrong asset feels productive and changes nothing. Chrome DevTools names it for you in the Performance panel, and Google’s LCP optimization guide walks through the sequence in detail.
The Fixes That Move Each Metric
These are the changes that pay for themselves most often across client work. For step-by-step instructions on a WordPress install, including which caching plugin fits which setup, read our guide to speeding up a WordPress site, which covers the platform detail this page deliberately skips.
Improving LCP
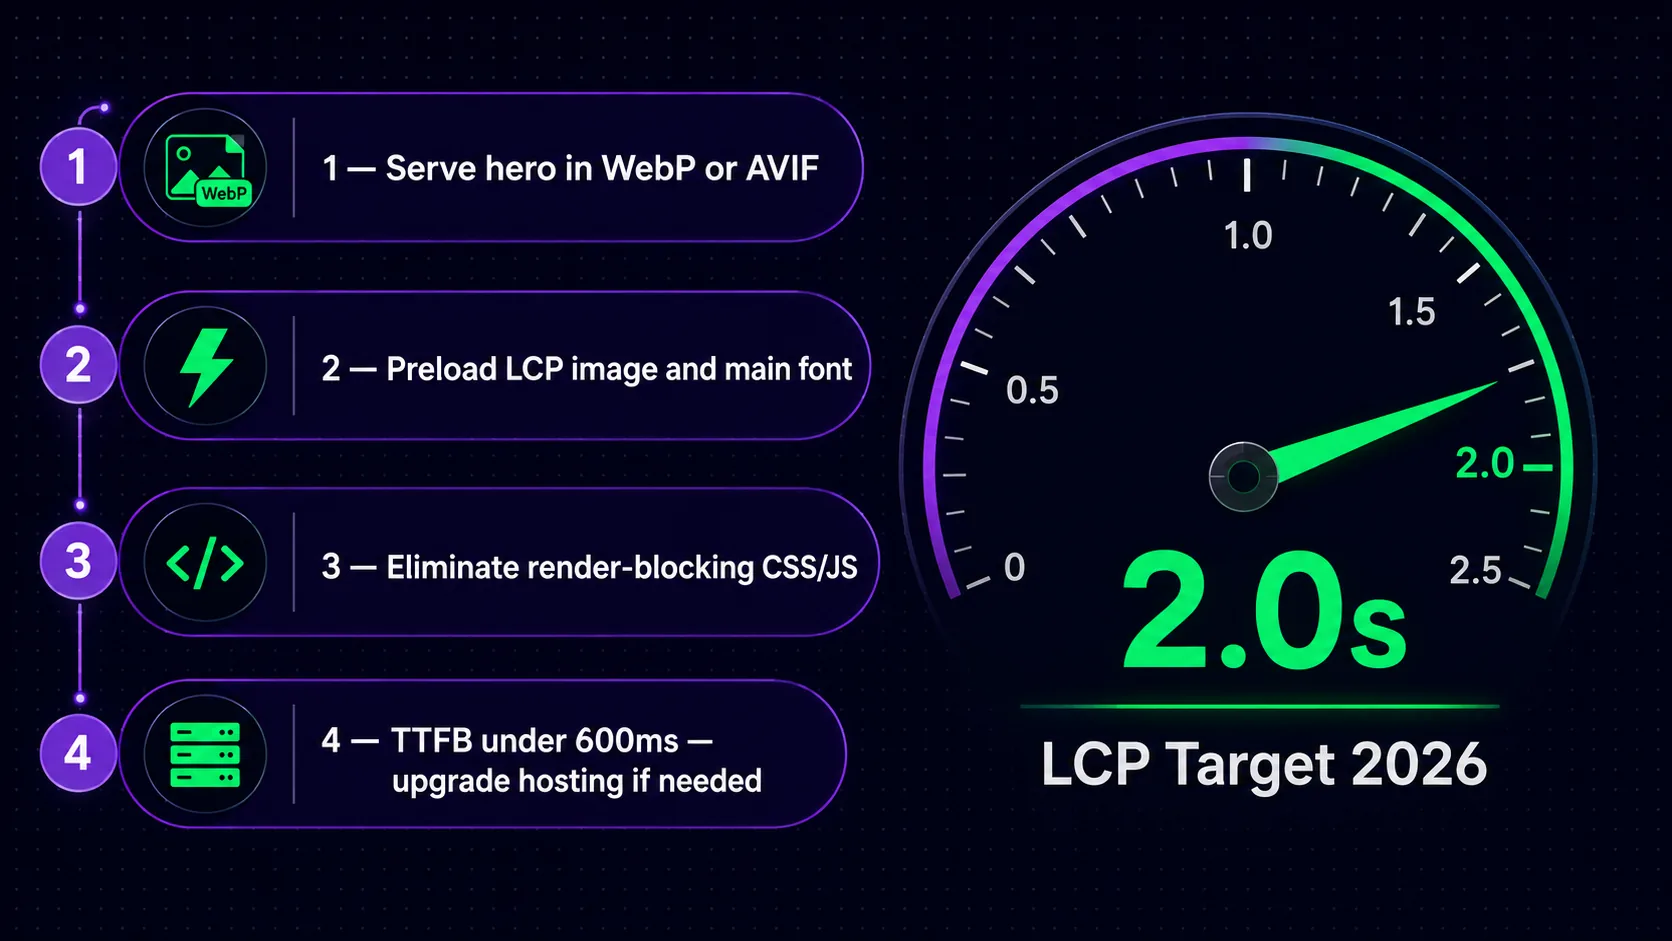
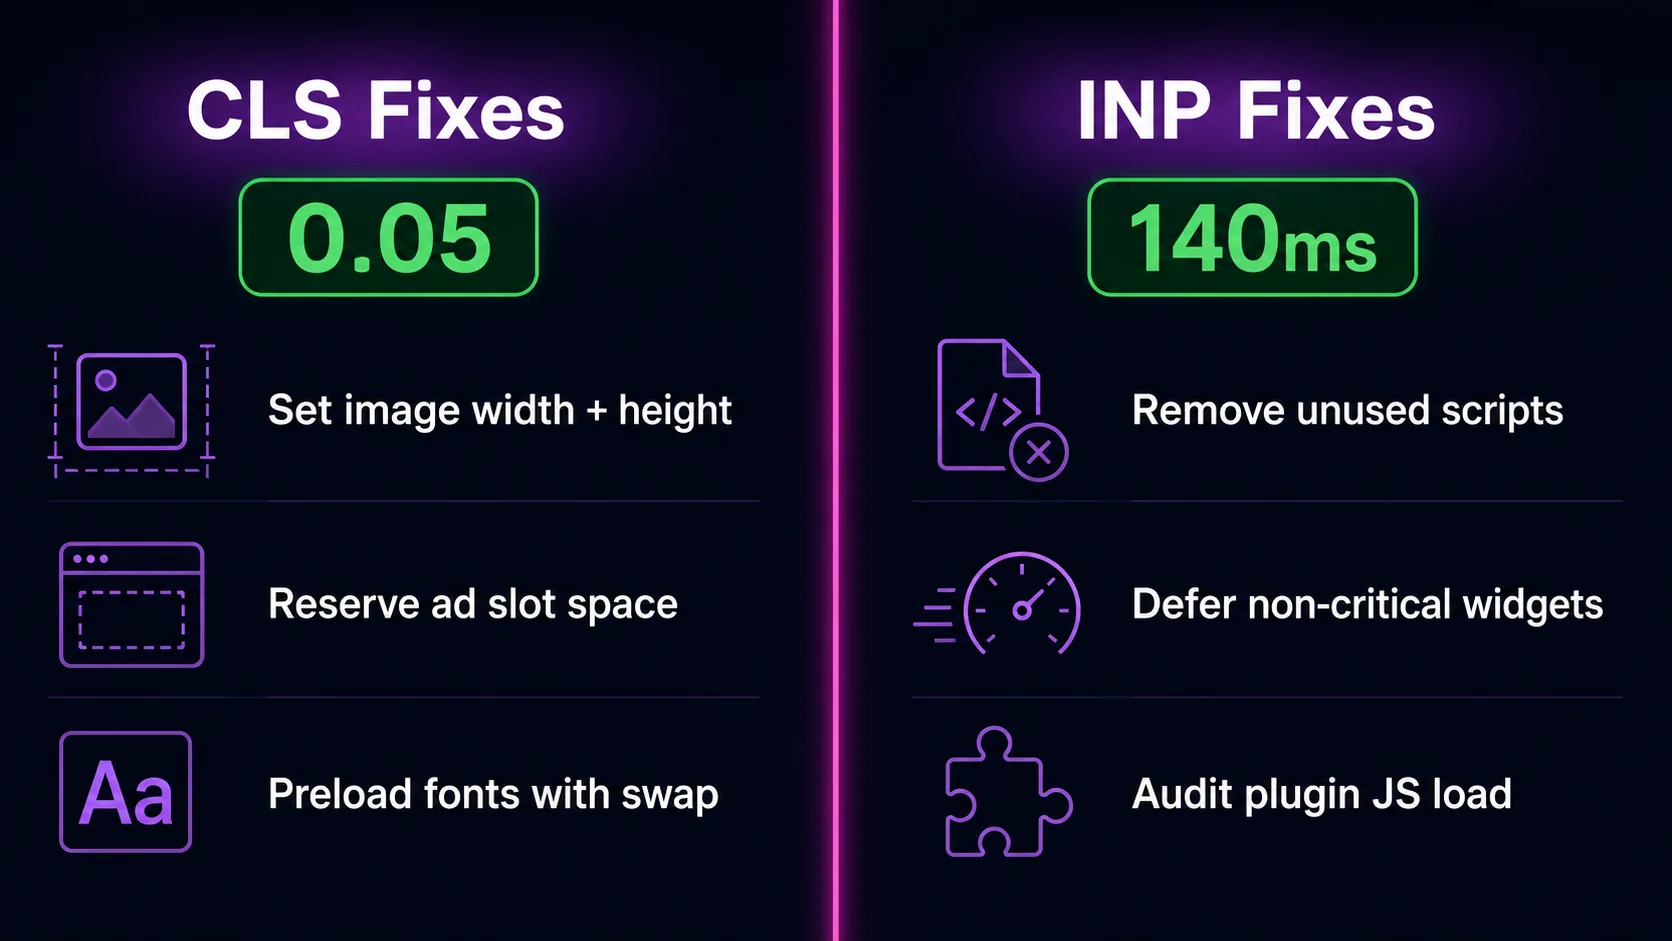
Serve the hero image in WebP or AVIF at the size it actually displays. Preload it and the font beside it. Remove render-blocking CSS and JavaScript above it. Then get server response time under 600 milliseconds, because if your host takes a second to answer, nothing you do in the browser will rescue the number.
Improving INP
INP is the metric we see fail most often in 2026, and the cause is almost always JavaScript occupying the main thread when someone taps. Audit what actually loads: analytics tags, chat widgets, heat-map scripts, cookie banners and plugins nobody remembers installing. Load what survives that audit after the page is interactive rather than before.
Improving CLS
Give every image, video, iframe and ad slot explicit width and height so the browser can reserve the space before the file arrives. Load fonts with a matched fallback so text does not reflow when the real font swaps in. Make cookie banners overlay the page instead of pushing it down, which is one of the most common sources of layout shift we find.
How Long Until Google Registers the Improvement
Field data runs on a rolling 28-day window, so give it a full month after your fixes go live before judging the result in Search Console. You can confirm the fix worked within minutes using a lab test, but the assessment Google grades you on only flips once enough real visits have accumulated under the faster version.
This catches people out badly. A fix deployed on the first of the month can still show yellow three weeks later simply because the window still contains the slow version. Deploy, verify in the lab, then leave it alone for a month.
When Core Web Vitals Are Not Your Problem
Here is the part the performance industry tends to leave out. Google has said plainly that perfect scores do not notably affect ranking, and that what a page actually says matters more. Page experience acts as a tiebreaker between pages answering a query equally well, not as a substitute for answering it.
We see this regularly. A site arrives convinced its rankings are a speed problem when it has four thin pages, no coverage of what its customers actually search for, and one referring domain. Getting LCP from 3.1 to 2.4 seconds will not fix that, and the honest answer is to say so rather than sell an optimization sprint.
Core Web Vitals are worth fixing for a simpler reason than rankings. In our measured set the slowest site took 103.7 seconds to show its main content. Nobody with a burst pipe waits that long. Speed is a conversion problem that happens to also be a ranking signal, and it is worth treating in that order.
The Short Version
Read your field data, find the one metric that is failing, and fix its largest single cause. Do not optimize assets that are not being measured, which was our own first mistake and cost us a week. Do not assume a lighter page is a faster one, because two sites in our set send more data and arrive sooner. Then wait a full 28 days before deciding whether it worked.
Passing all three metrics puts you ahead of 16 of the 18 businesses we measured. That is a wider margin than most owners expect, for work that usually takes days rather than months. If you would rather have it diagnosed and fixed properly, that is what our speed optimization service does, or ask for a fixed quote with your URL and we will tell you which metric is costing you the most before you commit to anything. Speed work can be scoped on its own rather than as part of a rebuild, and what that costs is published rather than quoted after a call.